UFC 3 -520-01
June 10, 2002
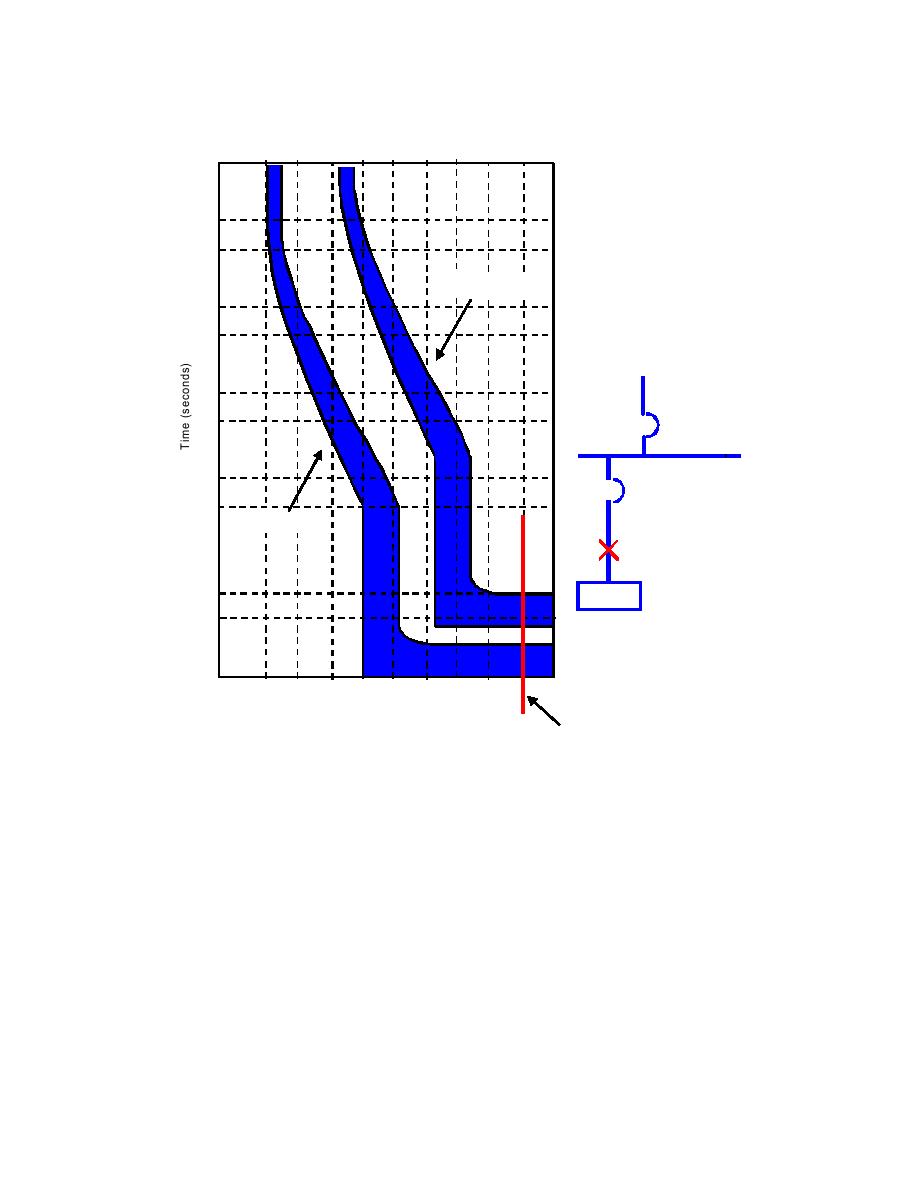
Figure 9-1. Selective Coordination Example
10000
5000
2000
1000
500
Feeder Breaker
200
100
50
20
Feeder
10
Breaker
MCC Bus
5
2
Load
Breaker
1
Load Breaker
.5
Fault
.2
.1
Load
.05
.02
.01
200
1
2
5
10
20
50
100
500
1000
Current (Multiples of Circuit Breaker Rating)
Maximum Available Fault Current
9-2.5.3 Circuit breaker curves usually begin at a point of low current close to the trip
device rating or setting and an operating time of 1,000 seconds. Relay curves begin at
a point close to 1.5 times pickup and the corresponding time for this point. Curves
usually end at the maximum short -circuit current to which the device under
consideration can be subjected. A single curve can be drawn for any device under any
specified condition, although most devices (except relays) plot an envelope within which
operation takes place. This envelope takes into consideration most of the variables that
affect operation. Some of these variables are ambient temperature, manufacturing
tolerances, and resettable time delay.
9-2.5.4 Figure 9-2 shows another example of selective coordination between an
MCCB and two fuses. Referring to Figure 9 -2, it appears that Fuse A does coordinate
with the breaker while Fuse B does not coordinate above about 3,000 amperes.
Confirm that Fuse A is operating within its current-limiting range before accepting the
coordination. Fuses are commonly used with breakers if short circuit currents are very
high to accomplish a current -limiting function so as to protect the breaker. At relatively
low short circuit currents, fuse clearing characteristics might not preve nt the
9-7


 Previous Page
